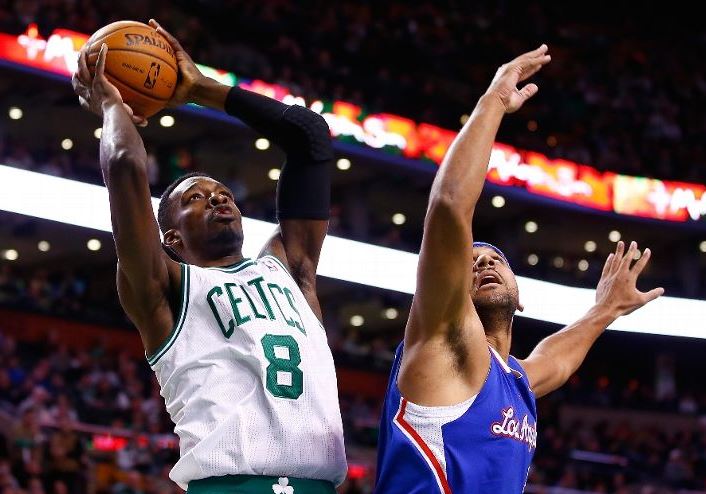
This post was submitted by reader Mike J. an entrepreneur/financial analyst who also claims to have aced his math SATs. Since we are bloggers and not mathematicians, we cannot confirm the legitimacy of these numbers. But this analysis sure seems to make sense.
One of the biggest knocks on Jeff Green has been his inconsistency. I have always believed in Jeff’s talent and his usefulness as a building block. So I decided to dig and find out how Jeff is doing, comparatively, with being consistent this season.
Here I compared Jeff’s consistency to that of LeBron James and Paul George… two of the premier small forwards in the league that are both similar in body type and athleticism. The conclusion was that, despite all 3 falling in different areas of productivity, Jeff Green has actually been the MOST consistent, by a significant margin.
Determining Productivity
Firstly, I needed to determine accurately the offensive contributions of each player. To do this I used a figure I call “Points Created Per 36” which is calculated as follows:
((Points) + (Assists * Team Weighted Points Per FG) + (Rebounds * Team Points Per Possession)) ÷ Minutes Played * 36 = PC/36
1 point scored = 1 point created
1 assist = 1 made field goal
Team value:
2.18 Points Created (Celtics)
2.22 Points Created (Heat)
2.20 Points Created (Pacers)
1 rebound = 1 possession
Team value:
0.984 Points Created (Celtics)
1.071 Points Created (Heat)
1.015 Points Created (Pacers)
Creating a Baseline
This analysis is imperfect for 2 reasons:
(1) Points Created Per 36 does not take into account shooting percentage
(2) the Baseline is subjective
Consistency is determined by observing how often a player competes relative to an expected performance. This expected performance (on average) is our baseline for consistency comparison. For this analysis the expected average performances are as follows:
Jeff Green: 20 Pts 5 Rbd 1 Ast = 27.10 Pts Crtd / 36
LeBron James: 25 Pts 7 Rbd 7 Ast = 48.04 Pts Crtd / 36
Paul George: 20 Pts 7 Rbd 4 Ast = 35.53 Pts Crtd / 36
Comparing “Consistency”
Initially I derived “consistency” mathematically, and the conclusion was the same as determining “consistency” graphically.
Mathematically:
(1) Calculate “Points Created Per 36” for each game log
(2) Take the absolute value of each calculation, from the baseline Points Created figure above
(3) Average all of these absolute values
This method derives how much, on average, a player strays from what’s expected of him.
Regardless of whether he overperforms by 5 Points Created or underperformed by 5 Points Created it doesn’t matter, it’s still a deviation from what’s expected. How far you deviate from the
expected is “consistency.”
The results of this method were “Consistency” values (lower = more consistent) of:
Jeff Green: *5.53 Consistency
LeBron James: 7.98 Consistency
Paul George 6.04 Consistency
Graphically:
To confirm these results, I then decided to plot the “Points Created Per 36” value from each game log, and see how frequently each player played in their “expected productivity zone.”
The productivity zones used were as follows:
Jeff Green: 22 – 32 Points Created Per 36 (Based on 27.10 above)
LeBron James 43 – 53 Points Created Per 36 (Based on 48.04 above)
Paul George 30 – 40 Points Created Per 36 (Based on 35.53 above)
Charted, the game logs looked like this:
As you can see Jeff’s Points Created Per 36 logs mostly fall in his expected range, while Paul George also does a good job, and LeBron James either way over-performs, or way under-performs.
Taking these as a percentage, each player performs with a “Consistency percentage” as follows:
Jeff Green: 12 (in the zone) / 24 (overall) = 50.0% Consistency Percentage
LeBron James: 6 (in the zone) / 22 (overall) = 22.7% Consistency Percentage
Paul George: 10 (in the zone) / 22 (overall) = 45.4% Consistency Percentage
In conclusion, Jeff is doing a very good job at putting together consistent games night in and night out this season.
I believe, given this consistency, Brad Stevens should make sure Jeff is putting up more than his current 12.9 shots per game, and see what he can really get out of him.
Add The Sports Daily to your Google News Feed!


